Monitoring Events
AvericsUnity provides an Events Viewer that enables users to monitor system events on a real time basis or to capture a snapshot of system events for later analysis.
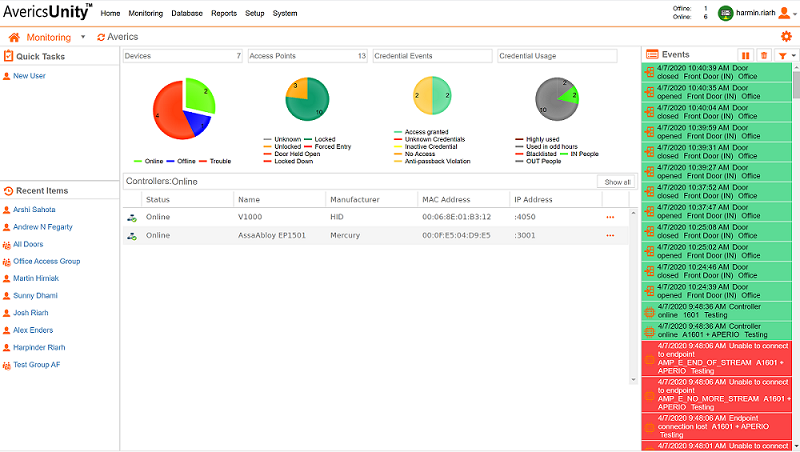
The Event Viewer is accessible from most screens under the Monitoring option on the main menu.
Events encompass any interaction between credential holders and the access control system, changes in the status of access devices, either locally on the device or through actions made through the software, in addition to any alarms. The event viewer also displays software related events such as user logins and login failures and changes to user profiles.
The Event Viewer appears on the right hand column of most screens that are accessed under the Monitoring option in the main menu.
Using the Event Viewer

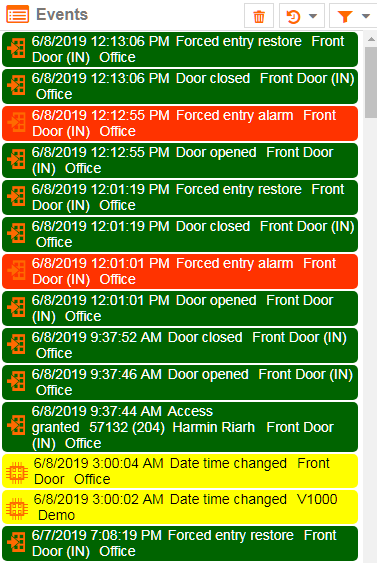
The Events Viewer displays events in real time in a vertically stacked set of colored tiles. The most recent event appears at the top of the list. Each event tile includes:
• An image representing an access point, device or user
• Date and time of event
• Description of event
• Name of the user and/or the device
The tiles are color-coded to indicate their importance
| Green | Notification of normal system events |
| Yellow | Notification of changes to devices, user profiles or other database items |
| Red | Warning of suspicious or unauthorized activity |
Filtering Events Viewer content
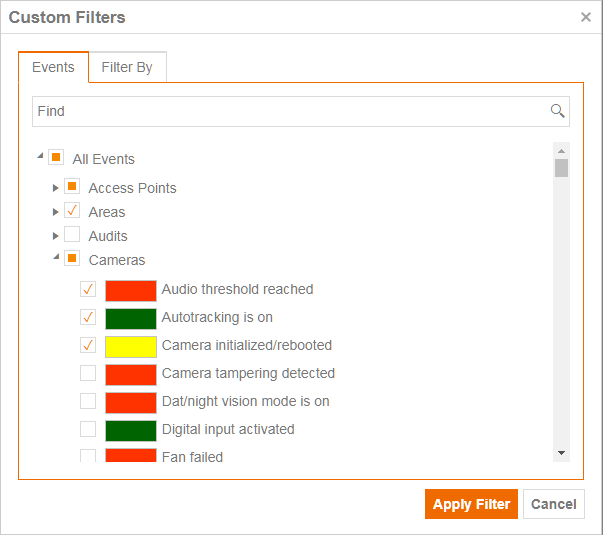
The events displayed by the Events Viewer can be filtered either by any combination of event type, user, controller, access point, input, output or site.
- Click the Filter icon at the top of the events viewer.

- Click Apply Filter...
- To select an event type, click the Events tab and click the check boxes for the types of events to be included in the Event Viewer.
- To select specific values for any event, click on the triangle next to the event type. This displays all possible values for the event.
- Click the check boxes to select the values to be included in the snapshot.
- To search for event names and values, use the search box at the top of the window, enter a word or phrase and click the magnifying glass. All options that include the search term are displayed.

- To filter by different types of records, click on the Filter By tab and click the plus "+" sign.
- Click the Select Record Type drop-down menu and click one of the record types.
- Click the Selection radio button.
- Use the check boxes to select all the record types to be included in the Event Viewer and click Select.

- To filter by additional record types repeat steps 9 and 10.
- When all filter selections have been made click Apply Filter.
Events Viewer Snapshot
A user can take a snapshot of all system events over a specified time period. This snapshot can be filtered by several criteria and can be viewed through the interface or exported to a CSV file (which can be viewed as a spreadsheet or other document) or as a PDF file.
- Click the Snapshot icon at the top of the events viewer.

- Select one of the preset time periods (which range from 10 minutes to one day) or Custom Snapshot
- For a Custom Snapshot either
- Enter the number of days (to a maximum of 500 days), or
- Enter start and end dates and times using the date picker and time picker
- Click Apply Filter. The snapshot is displayed in the main work area.
The Snapshot feature is not visible on the monitoring dashboard event viewer.
Searching the Snapshot
You can search for records in the snapshot. The search feature returns items in the snapshot where the value in the search box matches content in the snapshot's Date/Time, Event or Source fields.
- Click the search window in the top right corner of the main work area.

- Type in a term such as a name (or partial name) of an event, device, or the date or time.
- Click the magnifying glass icon. The snapshot is updated to include only items that match or partially match the term in the search box.
Filtering the Snapshot
The snapshot can be filtered to include only events that are useful to the user, by any combination of date/time range, event type, user, controller, access point, input, output or site.
- Click the filter icon in the top right corner of the main work area.

- To change the date/time range included in the snapshot click Date and Time.
- To select an event type, click the Events tab and click the check boxes for the types of events to be included in the Event Viewer.
- To select specific values for any event click on the triangle next to the event type. This displays all possible values for the event.
- Click the check boxes to select the values to be included in the snapshot.
- To search for event names and values use the search box at the top of the window, enter a word or phrase and click the magnifying glass. All options that include the search term are displayed.
- To filter by different types of record click on the Filter By tab and click the plus "+" sign.
- Click the Select Record Type drop-down menu and click one of the record types.
- Click the Selection radio button.
- Use the check boxes to select all the record types to be included in the Event Viewer and click Select.
- To filter by additional record types repeat steps 9 and 10.
- When all filter selections have been made click Apply Filter.
Exporting the Snapshot to a file
The contents of the snapshot can be exported to a delimited text file (CSV) or an Adobe Acrobat file (PDF). CSV files can be read in Excel, Google Sheets or another spreadsheet application. PDF files can be viewed in Adobe Acrobat or Adobe Reader.
- After generating a Snapshot file, click the triangle next to the Export option.
- Select either CSV or PDF. The file will be downloaded to your computer or device.