Monitoring Dashboard
The Monitoring Dashboard is a landing page designed for users who have responsibility for monitoring people, events and equipment through AvericsUnity.
The functionality that appears for a user on the Dashboard is defined by the Administrator.
The Dashboard screen contains four areas in three panels:
Left panel
-
Quick Tasks : A list of recently performed tasks, enabling easy access to features and information. The options that appear in this list are defined for individual users by the system administrator.
- Recent Items : A list of recently modified items such as device setups, user profiles.
To access a Quick Task or a Recent Item, click on the text or icon.
Main panel
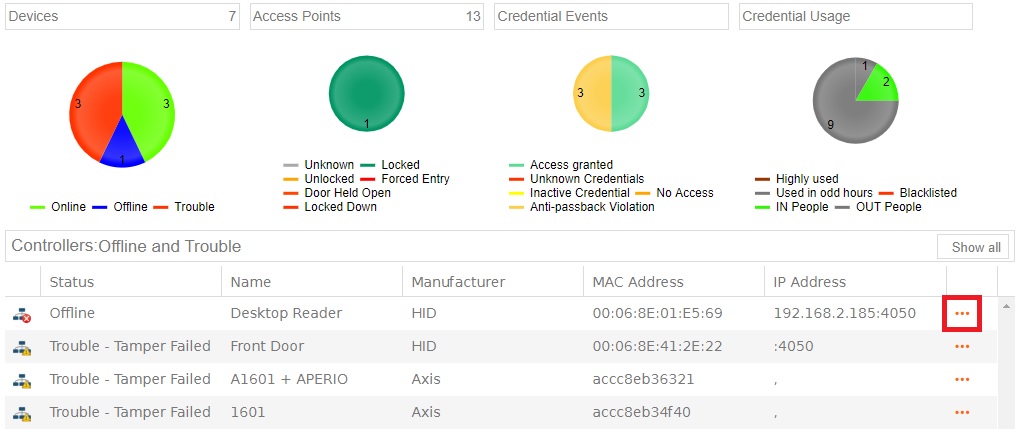
The main panel contains four pie charts that represent the statuses of devices, access points, credential events, and credential usage statistics. You are able to monitor health of your system from this single page.

Status Details are shown in the table containing details on the four types of items listed above with the capability to interact with devices, access points and credentials in the table.
The four pie charts determine the information that appears in the table immediately beneath the pie charts.
By default, all items represented in the pie chart are also listed in the table, with the exception of Devices, which by default lists only controllers that are in Offline and Trouble states.nTo filter what is displayed in the table:
- Click on one of the four pie charts: Devices, Access Points, Credential Events or Credential Usage.
- Click on any pie slice to filter the content displayed in the table to include only items relating to that slice.
Example: If a user clicks on the "Unlocked" slice for the Access Points pie then the list beneath shows only unlocked access points.
- To restore the details for all items in the table, click Show All at the top right of the table.
When viewing Devices, Access Points or Credential Usage there are options for interacting with the item. To access these options click on the three orange dots at the right of any row of the table.
Device commands can be used to check date/time or perform a file download. Similarly, Access Points can be locked/unlocked. To learn more about commands see Device commands table. Similarly
Right panel
The right panel shows the Events Viewer that shows real time list of recent events. For more information, see Monitoring Events.